ECO 201 SNHU Memorandum Report Identifies

Description

Competencies

In this project, you will demonstrate your mastery of the following competencies:

  • Inform business decisions using microeconomic models and theories
  • Determine the impact of economic costs on organizational and individual decision making
  • Explain how market structure impacts a business’s entry and exit into a market and its ability to generate economic profit

Scenario

You and your friend from college have just graduated. You majored in business, and your friend majored in a creative field. Your friend is highly inventive and has come up with an excellent idea for a new product. You both believe in this idea so much that you have agreed to become business partners. However, before you embark on your entrepreneurial adventure, you will have to explain some key microeconomics concepts to your partner that are important to make sound business decisions.

Your business partner is less than enthusiastic about this prospect and has never had an interest in what is often described as the dry and boring field of economics. Every time you have tried to engage your partner in practical discussions, they brush you off and decide to go play video games instead.

Aha! This gives you an idea: What if you could convince your friend to learn about economics through games? You have found several simulation games that demonstrate in real and interesting ways the economic principles that you know your partner needs.

Once you have played the games, you will create a memorandum report summarizing for your friend the educational value of your experiment. In your memorandum, you will restate the key principles and takeaways of each simulation, as well as illustrate how these ideas are relevant to your future entrepreneurial success.

Directions

First, assemble the materials that you will need to complete this assignment:

  1. You will need several simulation report images for your memorandum. All the necessary data visualizations will be generated after you have completed each simulation game. You will be required to save image files of your simulation reports for your simulation discussions. These should also be used to create your memorandum report for the course project. If you have any questions or concerns about the simulation data that should be used for your project, you should promptly reach out to your instructor.
  1. Review and use the Project Template located in the What to Submit section.

    You are expected to reference any source material used in your memorandum report with appropriate citations. To support you, a References page has been added to the project template with a citation for this course’s reading already provided. Any other references you add should be cited according to APA format.

Once you have assembled the required materials listed above, you can now begin drafting your memorandum report by completing the following steps:

  1. Comparative Advantage: Discuss the Comparative Advantage (With Trade) simulation that you played in Module Two. You should add the Production Decisions graph and the Production Trade graph (i.e., the graph showing how many hamburgers per fries) from you simulation report into the project template as Figures 1.1 and 1.2. Then, answer the following questions in the paragraphs below the figures:
    • How does this simulation demonstrate how individuals evaluate opportunity costs to make business decisions? Use the Production Decisions graph from the simulation as a reference to explain what role the production-possibility frontier (PPF) has in the decision-making process.
    • Explain how comparative advantage impacts a firm’s decision to engage in trade. Would a business’s decision to trade cause a change to its PPF? Provide specific reasoning to support your claims.
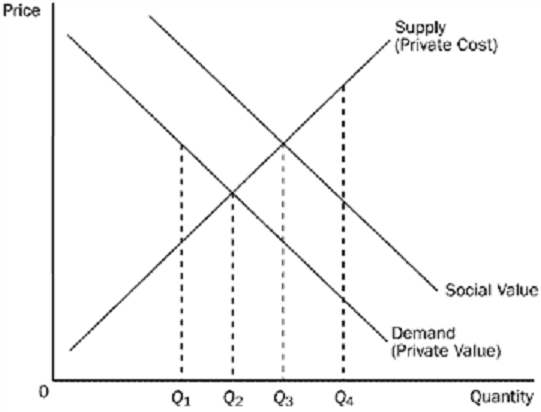
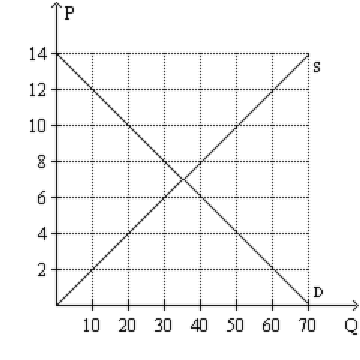
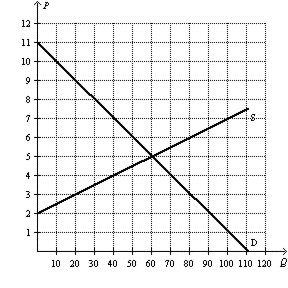
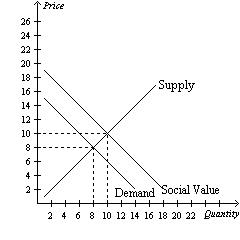
  1. Competitive Markets and Externalities: Discuss the Competitive Markets and Externalities simulations (both with and without policy interventions) that you played in Modules Three and Four. Add the Supply and Demand chart and the Outcomes by Market table from your simulation reports into the project template as Figures 2.1 and 2.2. Then, answer the following questions in the paragraphs below the figures:
    • What impact do policy interventions have on the supply and demand equilibrium for a product? Provide specific examples from the simulation to illustrate.
    • What are the determinants of price elasticity of demand? Identify at least three examples. Based on the outcome of the simulation, explain how price elasticity can impact pricing decisions and total revenue of the firm.
    • Based on the results of the simulation, can policy market interventions cause consumer or producer surplus? Explain why using specific reasoning.
  1. Production, Entry, and Exit: Discuss the Production, Entry, and Exit simulation that you played in Module Five. Add the Aggregate Outcomes chart from your simulation report into the project template as Figure 3.1. Then, answer the following questions in the paragraphs below the figure:
    • Analyze a business owner’s decision making regarding whether to enter a market. For example, what factors determined the driver’s market entry and exit in the simulation? Use economic models to support your analysis.
    • How does a business owner applying the concept of marginal costs decide how much to produce? For example, how did the driver determine how many hours to drive each day? Use economic models to explain.
    • How does the impact of fixed costs change production decisions in the short run and in the long run? Use the average-total-cost (ATC) model included in the module reading chapters to demonstrate this impact.
  1. Market Structures: Discuss the market structures simulations (Price Discrimination and Cournot) that you played in Modules Six and Seven. Then, do the following in the project template:
    • Complete Table 4.1 as a reference guide for your business partner. The table should compare the attributes of each of the four listed market structures.
    • Answer the following questions in the paragraphs below the table:
      • Explain what market inefficiencies derive from monopolies and monopolistic competition. Use examples from the textbook to support your claims.
      • How do firms in an oligopolistic market set their prices? Use specific examples from the simulations or from the textbook to support your claims.
      • Explain how firms that compete in the four different market structures determine profitability. Use specific examples from the simulations or the textbook to support your claims.
  1. Conclusions: Draw your overall conclusions about the relevance and significance of microeconomics. How will microeconomics principles impact your business decisions moving forward? Provide recommendations to your business partner for your future business venture.
  1. Finally, ensure that all of your sources are properly cited using in-line citations and references according to APA format.

What to Submit

To complete this project, you must submit the following:

Memorandum Report
Your memorandum report should summarize the key principles and takeaways of each microeconomics simulation for your business partner. It should also illustrate how these ideas are relevant to your future entrepreneurial success.

Template: Project Template Word Document
Use this template to structure your memorandum report, and submit it as a Word document. Sources should be cited according to APA style.

Supporting Materials

The following resources support your work on the project:

Video: How to Use the Snipping Tool (Beginner’s Guide) (for PC) (5:23)
Use this tutorial for help with snipping, copying, and pasting your data visualizations into your project template.

A captioned version of this video is available: How to Use the Snipping Tool (Beginner’s Guide) (CC) Video.

Resource: Is There a Snipping Tool for Mac?
Use this tutorial for help with snipping, copying, and pasting your data visualizations into your project template.

Resource: APA Style Basics
Use this resource to support your in-line citations and full references in the References section of your project template.

College American Economics Worksheet

Description

Question 13 pts

Consumers will be affected if the government imposes a tax on apples because

Group of answer choices

consumer surplus would increase.

the price of apples would increase and fewer apples would be purchased.

revenues for apple growers would decrease.

the government would collect revenue from the tax.

producer surplus would decrease.

Flag question: Question 2

Question 23 pts

In most cases, taxes make markets less efficient because

Group of answer choices

they lower prices for consumers and cause firms to suffer.

they increase firms’ profits at the expense of consumers.

taxes are perceived as unfair by some taxpayers.

the government often spends tax revenues on programs that some voters don’t like.

they reduce consumer surplus and producer surplus.

Flag question: Question 3

Question 33 pts

Taxes cause

Group of answer choices

both consumer and producer prices to increase.

the consumer price to increase but leave producer prices unchanged.

both consumer and producer prices to decrease.

the consumer price to decrease and the producer price to increase.

the consumer price to increase and the producer price to decrease.

Flag question: Question 4

Question 43 pts

After a tax is imposed, the difference between the price that consumers pay and the price that sellers receive equals

Group of answer choices

loss of social welfare from the tax.

per unit tax.

deadweight loss from the tax.

revenue from the tax.

lost profit from the tax.

Flag question: Question 5

Question 53 pts

What is the tax incidence?

Group of answer choices

who pays the tax out of pocket.

how much tax revenue the tax generates.

who bears the burden of the tax.

how the tax revenue from the tax is spent.

government efficiency in providing goods and services.

Flag question: Question 6

Question 63 pts

The DWL from a tax will be smaller when a product has

Group of answer choices

few complements.

many substitutes.

few substitutes.

an elastic demand.

an elastic supply.

Flag question: Question 7

Question 73 pts

The incidence of a tax is determined by

Group of answer choices

which side of the market is less sensitive to a change in price

who pays the tax out of pocket.

whether the supply curve or demand curve shifts as a result of the tax.

how much tax revenue it generates.

how much paperwork there is to complete.

Flag question: Question 8

Question 83 pts

As the size of a tax rate increases, eventually

Group of answer choices

supply can outweigh demand.

willingness to pay can outweigh deadweight loss.

demand can outweigh supply.

deadweight loss can outweigh tax revenue.

tax revenue can outweigh willingness to sell.

Flag question: Question 9

Question 93 pts

If the government puts a tax on the buyers of milk, then

Group of answer choices

buyers will bear the entire burden of the tax.

sellers will bear the entire burden of the tax.

buyers and sellers will share the burden of the tax.

the government will bear the entire burden of the tax.

Flag question: Question 10

Question 103 pts

The decrease in total surplus that occurs after a tax is imposed is called

Group of answer choices

wedge loss.

revenue loss.

deadweight loss.

consumer surplus loss.

Flag question: Question 11

Question 113 pts

Which of the following will decrease when the government puts a tax on a product?

Group of answer choices

the equilibrium quantity in the market for the good, the effective price of the good paid by buyers, and consumer surplus

the equilibrium quantity in the market for the good, producer surplus, and the well-being of buyers of the good

the effective price received by sellers of the good, the wedge between the effective price paid by buyers and the effective price received by sellers, and consumer surplus

None of the above is necessarily correct unless we know whether the tax is levied on buyers or on sellers.

Flag question: Question 12

Question 123 pts

The difference between social cost and private cost is the

Group of answer choices

loss in profit to the seller as the result of a negative externality.

external cost of an externality.

cost reduction when the negative externality is eliminated.

cost incurred by the government when it intervenes in the market.

Flag question: Question 13

Question 133 pts

Why do corrective taxes avoid the inefficiencies of most other taxes?

Group of answer choices

Corrective taxes apply only to goods that are bad for people’s health, such as cigarettes and alcohol.

Because corrective taxes take into consideration the costs to bystanders.

Corrective taxes provide incentives for the conservation of natural resources.

Corrective taxes do not affect deadweight loss.

Flag question: Question 14

Question 143 pts

After a tax is imposed, the price paid by consumers ________ and the price received by sellers ________.

Group of answer choices

increases; increases

increases; decreases

decreases; increases

decreases; decreases

is unaffected; is unaffected

Flag question: Question 15

Question 153 pts

Externalities

Group of answer choices

make markets inefficient.

cause equilibrium prices to be too high.

benefit producers at the expense of consumers.

cause equilibrium prices to be too low.

Flag question: Question 16

Question 163 pts

Which quantity is socially optimal?

Price Supply (Private Cost) Social Value Demand (Private Value) . 0 01 Q2 Q4 Quantity

Flag question: Question 17

Question 173 pts

To internalize the externality in this market, the government should

Group of answer choices

impose a tax on this product.

provide a subsidy for this product.

forbid production.

produce the product itself.

Flag question: Question 18

Question 1810 pts

TP 14 S 12 10 00 8 6 4 4 2 D 10 20 30 40 50 60 70

Assume a tax of $6 per unit is imposed on this market.

  1. What will be the new quantity exchanged in this market?
  2. What will be the new price that buyers pay?
  3. What will be the new price that sellers receive?
  4. How much of the tax will buyers pay?
  5. How much of the tax will sellers pay?

Flag question: Question 19

Question 1915 pts

12 12 11 10 9 8 7 6 5 3 2 1 D 10 20 30 40 50 60 70 80 90 100 110 120 2

The government adds a $3 tax to this market.

Calculate the following:

Consumer Surplus =

Producer Surplus =

Tax Revenue =

Total Surplus =

Dead Weight Loss =

Flag question: Question 20

Question 2012 pts

Price Supply ????? 26 24 22 20 18 16 14 12 10 8 6 4 1 Demand Social Value ++++++++ 2 4 6 8 10 12 14 16 18 20 22 Quantity1 Price 85 8 75+ 7 65+ 6 SS+ Social Cost 5 45 + Private Cost 4 35 3 25+ ??? 2 Demand 15+ 1+ OS ++ Quantity 100 200 300 400 50

a. What is the external cost?

b. What is the external benefit?

c. Is the private market doing too much or too little in the first

graph?

d. Is the private market doing too much or too little in the second graph?

Flag question: Question 21

Question 213 pts

Suppose a tax was reduced from $6.00 to $3.00. Compared to the $6.00 tax, the lower tax would

Group of answer choices

increase tax revenue and increase the deadweight loss from the tax.

increase tax revenue and decrease the deadweight loss from the tax.

decrease tax revenue and increase the deadweight loss from the tax.

decrease tax revenue and decrease the deadweight loss from the tax.

tax revenue would stay the same and decrease the deadweight loss from the tax

TESU High Low method Paper

Description

Final Projec


  1. HIGH-LOW METHOD

The following information is available regarding the total manufacturing overhead costs of Pay more, Inc., for five months in 2012:

Machine-Hours

Mfg Overhead Costs

February

6,900

$6,250

March

5,000

$5,375

April

6,300

$6,025

May

9,333

$7,975

June

6,833

$6,050

a. Using the high-low method, compute the following:

  1. The variable element of overhead cost per machine-hour:

$____________________ per machine-hour.

2.The fixed element of monthly overhead cost: $__________________.

b.Use the cost relationship determined in part a to estimate the total manufacturing overhead costs for July 2012, given that 7,250 machine-hours are scheduled. $_________________

2.JOINT PRODUCTION DECISIONS

Grassy Fertilizer manufactures two lines of garden grade fertilizer as part of a joint production process: GF10 and GF20. Joint costs up to Grassy’s split-off point total $85,000 per batch. These joint costs are allocated to GF10 and GF20 in proportion to their relative sales values at the split-off point of $40,000 and $60,000, respectively.

Both lines of garden grade fertilizer can be further processed into commercial grade fertilizer. The following table summarizes the costs and revenue associated with additional processing of GF10 and GF20:

Additional processing costs

Final selling price per batch of commercial grade fertilizer

GF10

$18,000

$67,000

GF20

38,000

97,000

a.The $85,000 in joint costs should be allocated to each product as follows:

GF10 $____________, GF20 $____________

b.Which product (GF10 or GF20) would result in a net decrease in operating income if processed into a commercial grade fertilizer? ____________

c.Which product (GF10 or GF20) would result in a net increase in operating income if processed into a commercial grade fertilizer? ____________

3.PREPARATION OF RESPONSIBILITY INCOME STATEMENTS

Hal-Marts, Inc., has two sales departments: equipment and clothing. During February, these two departments reported the following operating results:

Equipment

Clothing

Sales………………………………………………………………………………

$490,000

$250,000

Contribution margin………………………………………………………….

35%

50%

Traceable fixed costs………………………………………………………..

$29,200

$26,800

In addition, fixed costs common to both departments amounted to $54,400.

Complete the following responsibility income statement for Hal-Marts, Inc. Follow the contribution margin approach, and show percentages as well as dollar amounts. Conclude your income statement with the company’s income from operations.

HAL-MARTS, INC

Income Statement by Product Lines

For the Month Ended February 28, 20__

Segments

HAL-Marts, Inc.

Equipment

Clothing

Dollars

%

Dollars

%

Dollars

%

Sales

$490,000

$250,000

Contribution margin

4.STANDARD COST SYSTEMS VARIANCE COMPUTATIONS

Livingston Corporation recently implemented a standard cost system. The company’s cost accountant has provided the following data to perform a variance analysis for May:

Standard Cost Information

Direct Material Standard Price

$12 per pound

Standard Quantity Allowed Per Unit

4 pounds per unit

Direct Labor Standard Rate

$7 per hour

Standard Hours Allowed Per Unit

0.5 hours per unit

Fixed Overhead Budgeted

$24,000 per month

Normal Level of Production

12,000 units per month

Variable Overhead Application Rate

$1.80 per unit

Fixed Overhead Application Rate

($24,000/12,000 units)

$2.00 per unit

Total Overhead Application Rate

$3.80 per unit

Actual Cost Information

Cost of Material Purchased & Used

$429,000

Pounds of Material Purchased & Used

39,000 pounds

Cost of Direct Labor

$23,100

Hours of Direct Labor

4,200 hours

Cost of Variable Overhead

$17,750

Cost of Fixed Overhead

$24,200

Actual Volume of Production

10,400 units

Compute the following variances. Indicate whether each variance is favorable (F) or unfavorable (U):

a.Materials price variance: $__________

b. Materials quantity variance: $__________

c.Labor rate variance: $__________

d..Labor efficiency variance: $__________

e.Overhead spending variance: $__________

f. Overhead volume variance: $__________

5.CAPITAL BUDGETING

Golden Flights, Inc., is considering buying some specialized machinery that would enable the company to obtain a six-year government contract for the design and engineering of a futuristic plane. The machinery costs $975,000 and must be destroyed for security reasons at the end of the six-year contract period. The estimated annual operating results of the project are as follows:

Revenue from sales under the contract…………………….

$975,000

Expenses other than depreciation……………………………

$560,000

Depreciation (straight-line basis)……………………………..

162,500

(722,500)

Increase in net income from government contract………

$252,500

All revenue from the contract and all expenses (except depreciation) will be received or paid in cash in the same period as recognized for accounting purposes. You are to compute the following three factors for this project

a. Payback period: __________ years

b. Return on average investment: __________%

c. Net present value of the investment in this machinery, discounted at an annual rate of 12% (an annuity table shows that the present value of $1 received annually for six years discounted at 12% is 4.111): $__________

Developmental Economics Role of Bank Failures Question

Description

Each student is required to do a project. There are two types of projects. Type #1 is a book review. Type #2 is a term paper. You choose one of these types.

  1. Book Review

A book review requires that you (a) read a recently published book in economic history (b) write a “review” of it. Your review should summarize the basic theme(s) of the book; discuss its contribution to the literature; and critique the analysis and conclusions. Length should be approximately 10-12 pages, inclusive of any tables, footnotes, or additional references.

Here is a list of pre-approved books for review. You can choose one of these; or you can review a book of your choosing, however, you will need to discuss the title with me first.

You will need to obtain your own copy of the book. All of the books listed below can be purchased on-line; some may be available in our library (I have not checked).

NOTE: you are welcome to meet with me to discuss your book review.

Allen, Robert C. 2009. The British Industrial Revolution in Global Perspective. New York: Oxford University Press.

Berkowitz, Daniel and Karen B. Clay. 2011. The Evolution of a Nation: How Law and Geography Shaped the American States. Princeton, NJ: Princeton University Press.

Botticini, Maristella and Zvi Eckstein. 2012. The Chosen Few: How Education Shaped Jewish History, 70-1492. Princeton NJ: Princeton University Press.

Clark, Greg. 2014. The Son Also Rises: Surnames and the History of Social Mobility. Princeton, NJ: Princeton University Press.

Deaton, Angus. 2013. The Great Escape: Health, Wealth, and the Origins of Inequality. Princeton, NJ: Princeton University Press.

Diamond, Jared and James A. Robinson. 2010. Natural Experiments of History. Cambridge, MA: Harvard University Press.

Eichengreen, Barry. 2015. Hall of Mirrors: The Great Depression, the Great Recession, and the Uses and Misuses of History. New York: Oxford University Press.

Fishback, Price, et. al. 2013. Well Worth Saving: How the New Deal Safeguarded Home Ownership. Chicago: University of Chicago Press.

Floud, Roderick et. al. 2011. The Changing Body: Health, Nutrition, and Human Development in the Western World Since 1700. New York: Cambridge University Press.

Goldin, Claudia. 2021. Career and Family: Women’s Century Long Journey Towards Equity. Princeton: Princeton University Press.

Kuran, Timur. 2012 (paperback). The Long Divergence: How Islamic Law Held Back the Middle East. Princeton NJ: Princeton University Press.

Lindert, Peter. 2004. Growing Public: Social Spending and Economic Growth since the Eighteenth Century, Volume 1. New York: Cambridge University Press.

Mokyr, Joel. 2009. The Enlightened Economy: An Economic History of Britain, 1700-1850. New Haven CT: Yale University Press.

Pomeranz, Kenneth. 2000. The Great Divergence: China, Europe, and the Making of the Modern World Economy. Princeton, NJ: Princeton University Press.

  1. Term papers

Term papers should be approximately 10-12 pages in length, inclusive of all tables, footnotes, and references. A term paper could be a systematic review/analysis of the professional literature on a topic; it could be an attempt to replicate the findings of an existing study; it could be an original piece of research (such as a regression analysis of historical data); or it could be a proposal for a research project. Because there are so many possibilities, if you wish to write a term paper, you need to make an appointment to see me VERY early in the semester to discuss potential topics (AND it would be a good idea to meet with me regularly on your progress). Please note: in the case of original research, I am willing to entertain co-authored term papers (no more than two authors per paper, however)

Topic 1: the industrial revolution

topic2: railroads and American economic development

topic 3: agriculture and environment

topic 4:urban and regional development

topic 5: slavery and its aftermath

Topic 6a: Fertility
Topic 6b: Health and Mortality
Topic 7: Female Labor Force
Topic 8: Inequality and Mobility
Topic 9: The Great Depression

Finance Macro Investment Strategy Worksheet

Description

Short-Answer Questions (10 Points Each)

1. Using the Mundell Fleming Model with fixed exchange rates, show the impact of an increase

in taxes on GDP, the exchange rate and Net Exports? Carefully explain using an appropriate

diagram. (1 paragraph and a diagram is required)

2. Suppose there is inflation in Hong Kong. The HKMA conducts an open market operation

sale, what is the impact on the exchange rate and Net Exports, Real GDP and inflation? Is the

HKMA policy likely to be effective in controlling inflation? Carefully explain using an

appropriate diagram. (1 paragraph and a diagram is required)

3. Does the HKMA independently control Monetary Policy in Hong Kong? Explain. (1

paragraph. Not diagram required)

4. We can say that a large open economy, like the United States can be modeled using an

average of the closed economy ISLM model and a small open economy (Mundell Fleming)

model, with flexible exchange rates. Based on the conclusions we have reached from studying

these models, if the objective is to boost employment, rank in order (ie. 1, 2, 3) of most

effective to least effective the following: monetary policy, trade restrictions (trade policy) and

fiscal policy, in the US. Explain your reasoning. (1 paragraph. Not diagram required)

5. Suppose it can be argued that a large economy like China can be modeled using an average

of the closed economy ISLM model and a small open economy (Mundell Fleming) model with

fixed exchange rates. Based on the conclusions we have reached from studying these models,

if the objective is to boost employment, rank in order (ie. 1, 2, 3) of most effective to least

effective the following: monetary policy, trade restrictions (trade policy) and fiscal policy, in

China. Explain your reasoning. (1 paragraph. Not diagram required)

6. Suppose a deal is struck between a consortium of Chinese SOE’s, to provide cash,

machinery, and technology, designed to help oil extraction and processing, to the Venezuelan

Government in exchange for an equity stake in some oil fields in Venezuela. Suppose this deal

radically improves the fiscal position of the Venezuelan government. Given this information,

what would be your policy advice be to the Venezuelan authorities to end the inflationdepreciation spiral? Explain using theory and intuition (No Diagram required, 1-2 paragraphs

required)

7. Suppose after some deliberation, the US government, under President Biden decides to

unwind the Trump-era tariffs. Given the relatively high dependence on trade in China, in

comparison with the US, what is the likely impact on the Chinese RMB? Explain carefully using

a diagram of equilibrium foreign exchange. Explain the theory and intuition carefully. (Diagram

is required, 1-2 paragraphs required)

8. Referring to the FOMC policy release statement of March 16, outline carefully the data that

the Fed is reacting to in particular in its recent change in the policy rate, reflecting its “Dual

Mandate”. (No Diagram Required)

9. We continue the background story from question 6, where a consortium of Chinese SOE’s

has offered a deal for cash, investment and technology in exchange for equity in oil fields in

Venezuela. Use a bond market diagram to illustrate and explain the impact on the market for

Venezuelan Sovereign Bonds. Also show, using an appropriate foreign exchange market

diagram, the likely impact of this event on the Venezuelan Bolivar. Is there any link between

your two diagrams? (2 Diagrams required, 2-3 paragraphs required).

10. Using the model of demand and supply in the foreign exchange market, demonstrate the

effect of an increase in the foreign interest rate. Explain your diagram carefully. (1 paragragh,

Diagram is required).

Johns Hopkins University Econometrics Worksheet

Description

1) In 1980, Cuba “exported” a large number of former prisoners to Miami, in what was called theMariel Boatlift. This increased the supply of labor in Miami by 7%. David Card proposed to usethis “natural experiment” to create a Differences in Differences estimate of the effect ofimmigration on the local unemployment rate for whites. To do so he compared Miami in 1979 and1981 versus a set of other similar cities that were not affected by the Boatlift. His resultsfor the unemployment rate for whites were as follows:1979 1981Miami 5.1% 3.9%Other cities 4.4% 4.3%

a) Calculate the Differences in Differences estimator of the effect of the Boatlift on theunemployment rate

b) Explain the assumptions that are needed if the Differences in Differences estimator is toprovide an unbiased estimate of the effect of the Boatlift

c) Do your results seem plausible? If so: explain why you think the assumptions in b) aresatisfied. If not: explain what could be wrong with the assumptions.

d) Suppose we implement this differences-in-differences estimator using a regression equation asfollows, where “Unemp” is the white unemployment rate as a percentage, “Miami” is a dummy =1 forMiami and =0 for comparison cities, and “Y81” is a dummy=1 for 1981 :Unemp = a + b*Miami + c*Y81 + d*(Miami*Y81) + errorUsing the results in the table, state the values of the regression estimates for parameters a,b, c, and d.

2) This exercise uses the data from EZUNEM.DTA, which are described in Example 13.8. The idea isto see if designating a city as an enterprise zone (which usually means granting big tax breaksto employers) will reduce the unemployment rate.

a) Run a regression of the log of the number of unemployment claims (luclms) against a set ofyear dummies and the enterprise zone variable (ez), using heteroskedasticity-robuststandard errors. What do you conclude about the effect of enterprise zones? What do thetime dummies tell you about trends in unemployment? What problems might this model have?

b) Run the same regression using first differences (FD) for luclms and for ez; still useheteroskedasticity-robust standard errors. Now what do you conclude about enterprisezones? Explain how this model differs from the model in a) and why that might matter.What problems might this model have?

c) Test the model in b) for the presence of serial correlation in the differenced errorterms, using the method Wooldridge introduces in Section 13.5. What do you conclude?

d) Rerun the model in b) with standard errors that are robust to heteroskedasticity AND toserial correlation of observations from the same city. What changes?

e) Rerun the regression using city fixed effects (FE), with heteroskedasticity and serialcorrelation robust standard errors. Now what is your conclusion?

f) Rerun the equation using city random effects (RE), with heteroskedasticity and serialcorrelation robust standard errors. Now what is your conclusion?g) After re-reading the section in Wooldridge called Fixed Effects or First Differencing andalso the section called Random Effects or Fixed Effects, explain which estimates (OLS, FD,FE, or RE) you think give the best estimate of the effect of enterprise zones on countyunemployment. Would you argue that enterprise zones have any effect, based on thisevidence?

The Production of The Global Fitness Tracker Watches Question

Description

Question

Analyze a competitive situation or industry in a 4 to 6 page, APA formatted written paper. It must be a strategy paper, meaning it must be about firms. However, there is a great deal of flexibility in the choice of topic.  

Step 1

First, choose an industry, based on interest in the industry. Examples of industries range from advertising to zoos, and include digital watches, private jets, diapers, over-the-counter cold and flu formulas, photographic film, automobiles, airlines, football, romance novels, dating services, banana production, or pre-stressed concrete, computer printers, pagers, business schools, used cars sold over the web, movie theaters.  

Step 2

Having chosen the industry, you will need a question or issue on which to focus. Such questions could be broad (What strategies are most likely to sustain profitability?) or narrow (Should firm X build a new plant? Where?). Good questions encourage you to think strategically, and thus should include the likely responses of rival firms to any hypothetical actions. Plan to include your question in the topic proposal.  A different approach is to choose a story about the behavior of a firm from a newspaper or other source, and research this story. For example, the defense contractor Lockheed-Martin announced a friendly takeover of Northrop-Grumman, and then later dropped the plan after the Department of Justice filed an antitrust complaint. This story contains a dozen potential paper topics. How is the defense industry organized? Why did they want to merge? Why did the DOJ want to block the merger? Choose a topic in which you are interested rather than one that looks easy. Topics that look easy can be treacherous and unpleasant if they are boring. 

Step 3

Develop your written response.  An important aspect of business communication is the elimination of the extraneous. Supporting exhibits are not counted in the page total. Using a few well-chosen exhibits is a better strategy than many irrelevant exhibits. It is important to provide references for facts you rely on in the analysis.  The paper’s focus should be on analysis, with industry description provided to support that analysis. A common mistake is too much description, too little analysis.  Do not choose a situation from a case reading from this or another class. Do not revise a paper you wrote for another course as a project without discussing it with me — it would have to be a new paper to be approved.  This project is intended for you to perform hands-on strategic analysis. If you were handed a project to analyze a strategic situation by the CEO of your company, what would you hand back?  

IMPORTANT!

When you have collected a great deal of information and begun to rough out your topic, run through this list of tools and ensure that you analyzes the most relevant ones to your topic. 

  • Five Forces 
    • Entry barriers, rivalry usually, but not always, the most significant  
  • Complements  
  • Differentiation 
    • Is one dimension enough?  
  • Cooperation  
  • Pricing
  • Market segmentation  
  • Rivalry 
  • First mover advantages and disadvantages  

Northern Virginia Community College Macro Economics Essay

Description

Hello! I am working on a few short answer questions for Macro econ. There are only 8 questions and each response must be 3-4 sentences long. Overall easy assignment!!!

1.) How does subjective value make “gains from trade” possible?

2.) Think back to August 6, 1945. The United States has just dropped an atomic weapon on the city of
Hiroshima killed tens of thousands of Japanese and devastated the infrastructure. A Keynesian at that
time might conclude that there is a silver lining in the destruction, as economic prosperity will result.
Evaluate the logic of this claim in a few sentences.

3.) Most introductory economics textbooks have a section on “market failure.” It is here that students
learn that markets may fail to achieve their potential – leaving people worse off than they theoretically
could be. The existent of market failure is often taken as an excuse for government intervention to do
whatever markets fail to do. In just a couple of sentences, explain why economists (and others,
particularly politicians) must accept the possibility of “government failure” as well? That is, tell me why
government solutions to perceived market “failures” may themselves fail to achieve their own stated
goals? The U.S. Drug war is an apt example of a discrepancy between a stated political policy goal and
the actual attainment of that goal.

4.) How might price controls on gasoline lead to human fatalities in an area where there is an oncoming
hurricane?

5.) Some economists argue that minimum wage policy does not always lead to the unemployment
consequences that are so often predicted. For the sake of argument, grant that this is true. That is, due to
the passage of say, a $15 minimum wage in Virginia, no one loses his or her job. Does this prove that
minimum wage policy can improve the economic circumstances of unskilled laborers? Why or why not?

6.) Does Elon Musk suffer from scarcity? Explain.

7.) The logic of politics often leads to very different market outcomes than if the logic of economics
were being used to allocate scarce resources. In our discussions, we covered a concept called
“concentrated benefits, dispersed costs” that might help one understand this disparity. Briefly explain
what the concept means and then give an example of applying it to say, farm price supports (a type of
price control we covered, but other examples may be used).

8.) Is the following claim logical? Explain your answer. Actor Matt Damon will be more likely to buy a court-side Boston Celtics basketball seat because they are more expensive.


ECON 201 SEU Financial System Saving and Investment & Unemployment Questions

Description

Chapter 13, 14 & 15: Critical Thinking:Financial System: Saving and Investment &

Unemployment and Its Natural Rate: (10 Points)

In the second assignment for the Macroeconomics course, the students are required to choose a specific area from the subject and answer the questions given, upon successful completion of the assignment; the student should be able to achieve the following learning outcomes:

Learning Outcomes:

Describe how to evaluate macroeconomic conditions such as unemployment, inflation, and growth. [CLO 1.2]

Recognize the fundamental determinant’s of a nation’s long-run economic growth. [CLO 1.3]

Reference Source: 

Textbook: – Mankiw, N. Gregory. Principles of Macroeconomics, 6th ed. Mason, OH: South-Western Cengage Learning, 2011. ISBN: 9780538453066 (hard copy); ISBN: 9781115468523 (eBook)

Q.1. Critical Thinking: Financial System: Saving and Investment: Chapter 13: (4 Points)

Suppose the government borrows $20 billion more next year than this year.

a. Use a supply-and-demand diagram to analyze this policy. Does the interest rate rise or fall?

b. What happens to investment, private saving, public saving, and national saving? Compare the size of the changes to the $20 billion of extra government borrowing.

  • c. How does the elasticity of supply of loanable funds affect the size of these changes?
  • d. How does the elasticity of demand for loanable funds affect the size of these changes?

e. Suppose households believe that greater government borrowing today implies higher taxes to pay off the government debt in the future. What does this belief do to private saving and the supply of loanable funds today? Does it increase or decrease the affects you discussed in parts (a) and (b)?

Important Note: – Support your submission with course material concepts, principles, and theories from the textbook and at least two scholarly, peer-reviewed journal articles.

Q.2. Critical Thinking: Financial System: The Basic Tools of Finance: Chapter 14: (3 Points)

When company executives buy and sell stock based on private information they obtain as part of their jobs, they are engaged in insider trading. 

a. Give an example of inside information that might be useful for buying or selling stock. 

b. Those who trade stocks based on inside information usually earn very high rates of return. Does this fact violate the efficient markets hypothesis? 

c. Insider trading is illegal. Why do you suppose that is?

Important Note: – Support your submission with course material concepts, principles, and theories from the textbook and at least two scholarly, peer-reviewed journal articles.

Q.3. Problems and Applications: Unemployment: Chapter 15: (3 Points)

The Bureau of Labor Statistics announced that in April 2010, of all adult Americans, 139,455,000 were employed, 15,260,000 were unemployed, and 82,614,000 were not in the labor force. Use this information to calculate: 

a. The Adult Population 

b. The Labor Force 

c. The Labor-Force Participation Rate 

d. The Unemployment Rate

University of Michigan Ann Arbor Economics Question

Description

Question 1 

According to the article about cap-and-trade by Robert Stavins, what types of transaction costs can occur in tradeable permit markets?

Question 1 options:

Searching and information-collection

Bargaining and deciding

Monitoring and enforcing

All of the above

Question 2 

Luckily, empirical evidence from cap-and-trade systems for leaded gasoline and sulfur dioxide (SO2) in the US show that transaction costs have been minimal.

Question 2 options:TrueFalse

Question 3 

In the second Grist.com article for this week, how did Georgia Power avoid paying abatement costs for coal ash?

Question 3 options:

Buying up land across the country for conservation and preservation.

Buying up land near coal-power plants so ground contamination would be on Georgia Power owned land and they wouldn’t have to pay for remediation. 

Buying up patches of coal so they would have more coal to use to power their plants.

None of the above. 

Question 4 

We know that abatement means scaling back or reducing. Abating coal ash pollution would be costly for Georgia Power because the coal ash would need to be held in a more protective way than unlined ponds, the water quality would need to be closely monitored, and contamination that leached beyond their property lines would need to be cleaned up. Which of the following constitutes a benefit from coal ash abatement (these would help us find MABs for coal ash abatement)?

Question 4 options:

Improved health for residents near by coal ash retention ponds. 

Increased house values for home near coal ash retention ponds.

Improved ecosystem quality due to less heavy metal contamination in the watershed.

All of these are true.

Question 5 

When a consumer buys a stock on an online trading platform like Robinhood, the moment they purchase a stock on the website they immediately own the stock(s) they purchased. 

Question 5 options:TrueFalse

Question 6 

According to the Planet Money podcast, which of the following is not part of why Robinhood had to halt some stock orders in January 2021?

Question 6 options:

Robinhood is a trading platform but does not actually execute stock trades. Rather it uses another company to perform the actually trading in the stock market. 

There is a lag between when orders are placed by Robinhood users and formally executed and closed. Robinhood has to post money each day to cover the amount of money their users owe for open trades to ensure orders will be paid for. 

Robinhood didn’t have enough money to post to the clearinghouse to cover the increased demand for trades through their platform because of the popularity of stocks like GameStop, Blackberry, and Motorola. 

Robinhood was retaliating against non-hedge fund traders.